Cloud Observability Platform
This web app is monitored end-to-end using Grafana, Prometheus, and Loki. The project showcases complete cloud observability on AWS EC2, automated through Terraform and a GitHub Actions CI/CD pipeline.
Observability Stack

Grafana
Visualizes dashboards, metrics, and logs in real time from Prometheus and Loki.

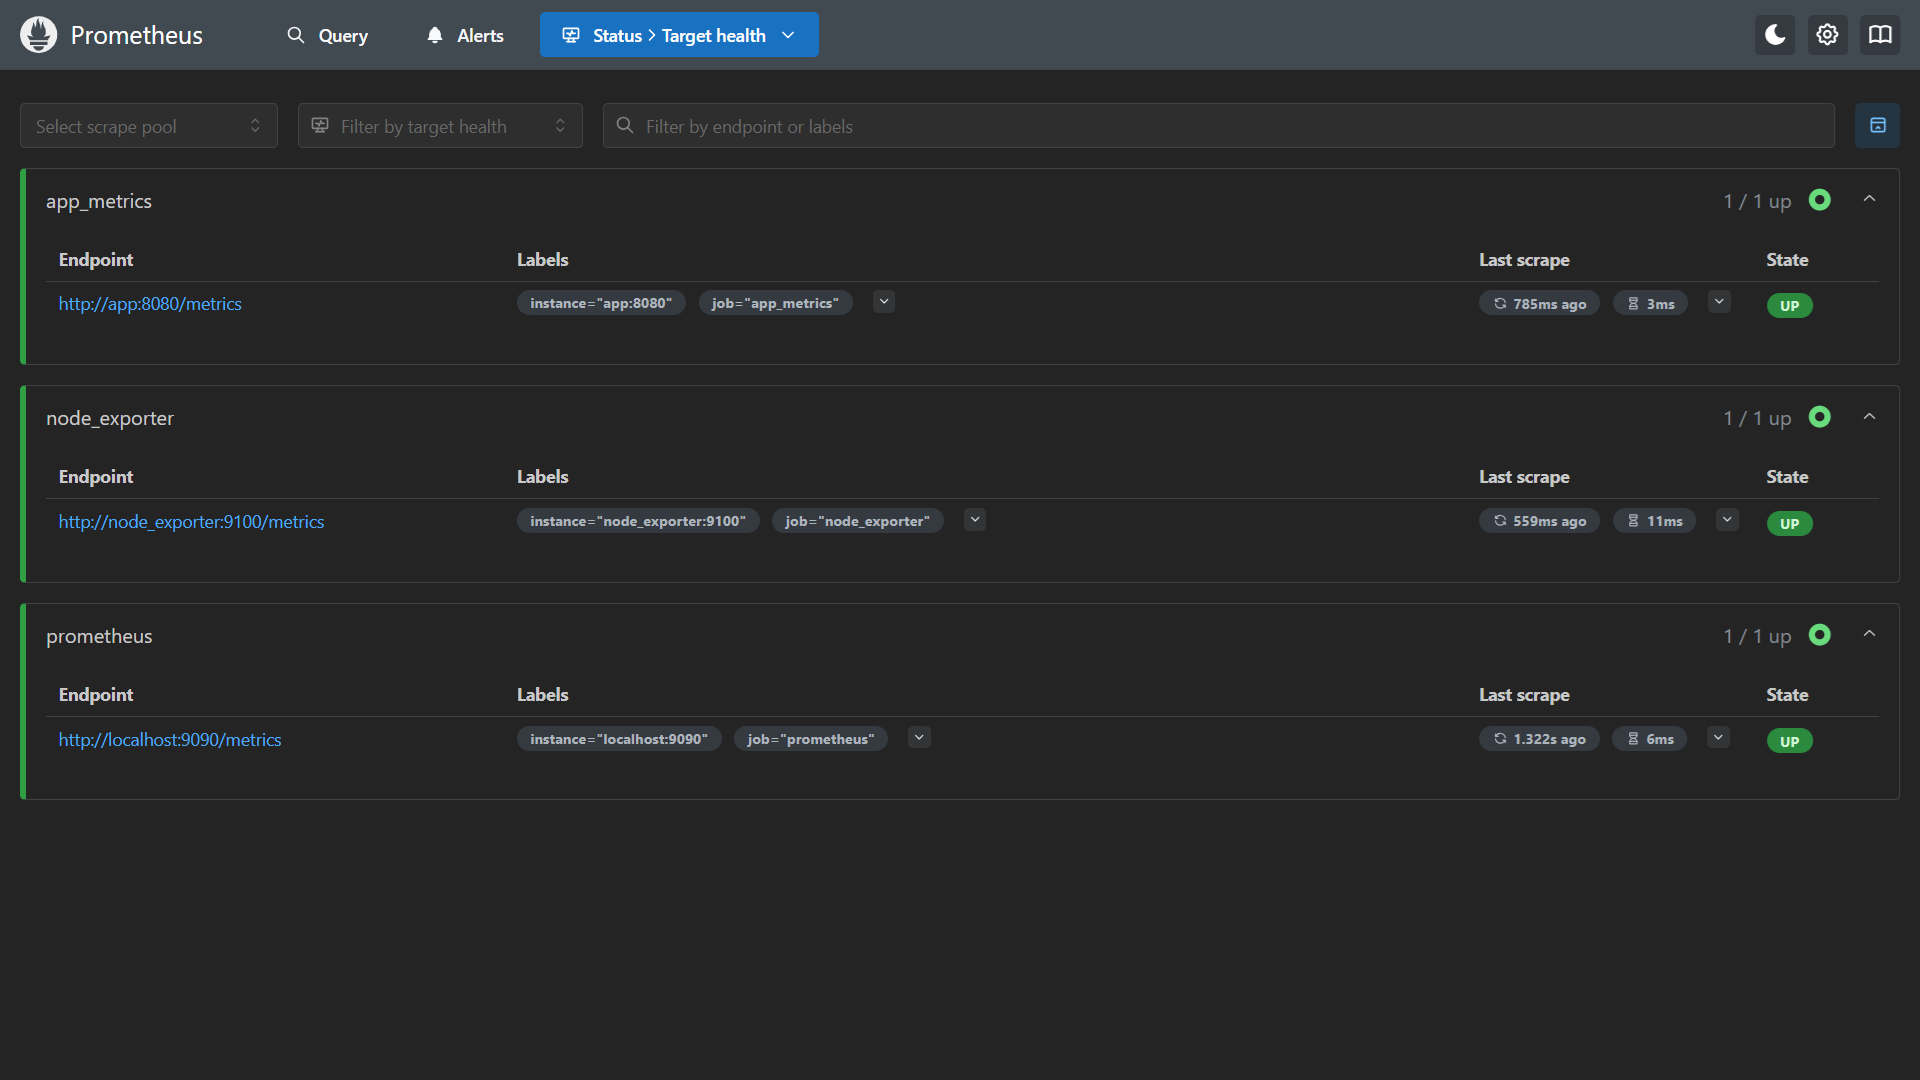
Prometheus
Scrapes and stores metrics from Node Exporter and the app using HTTP endpoints.
Loki
Collects container logs, enabling fast debugging by correlating logs and metrics.
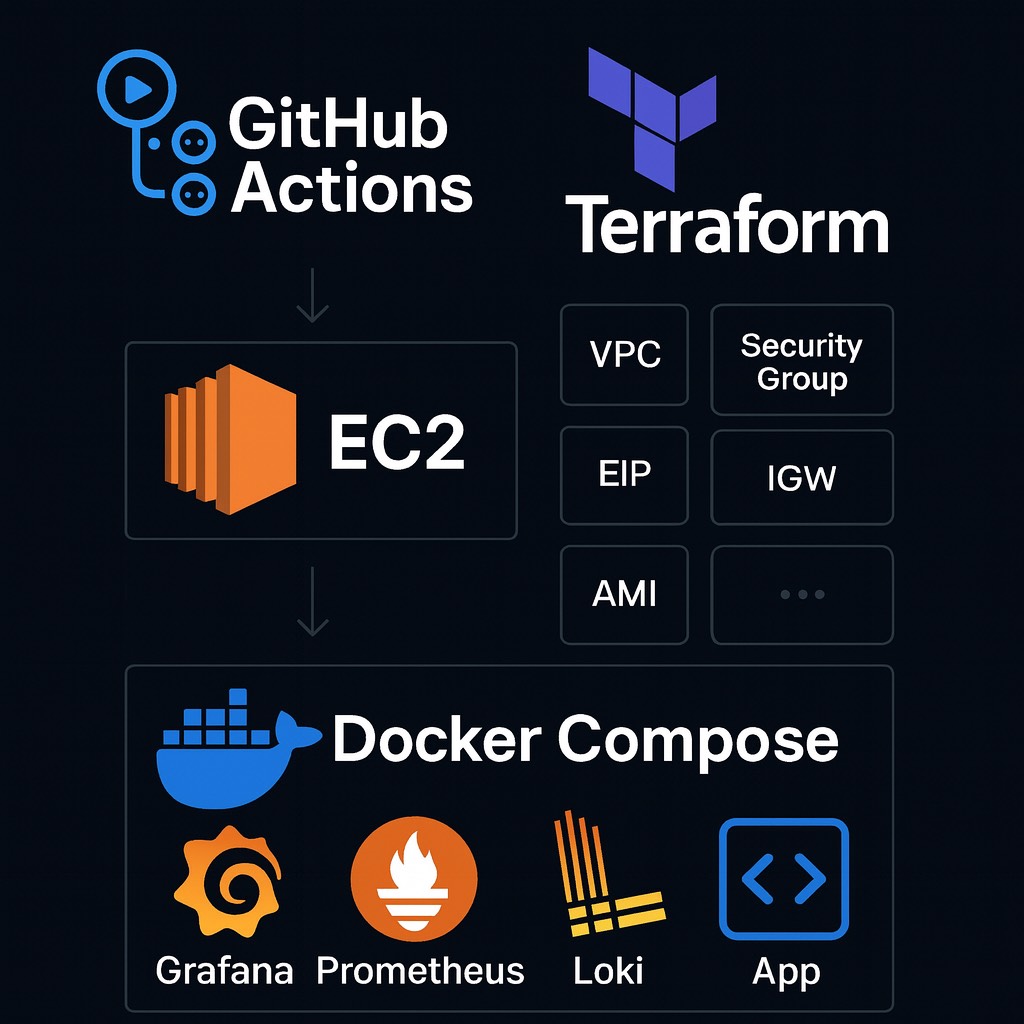
Project Architecture
The diagram below shows the overall flow — Terraform builds the EC2 environment, Docker Compose orchestrates monitoring containers, and CI/CD keeps everything updated.
CI/CD Pipeline
Each push to the main branch triggers automated deployment:
- Starts the AWS EC2 instance automatically.
- Copies updated monitoring and app directories to the instance.
- Rebuilds and redeploys containers using Docker Compose.
- Verifies all observability services are running successfully.
View the full workflow on GitHub:
GitHub Actions Workflow (deploy.yml)
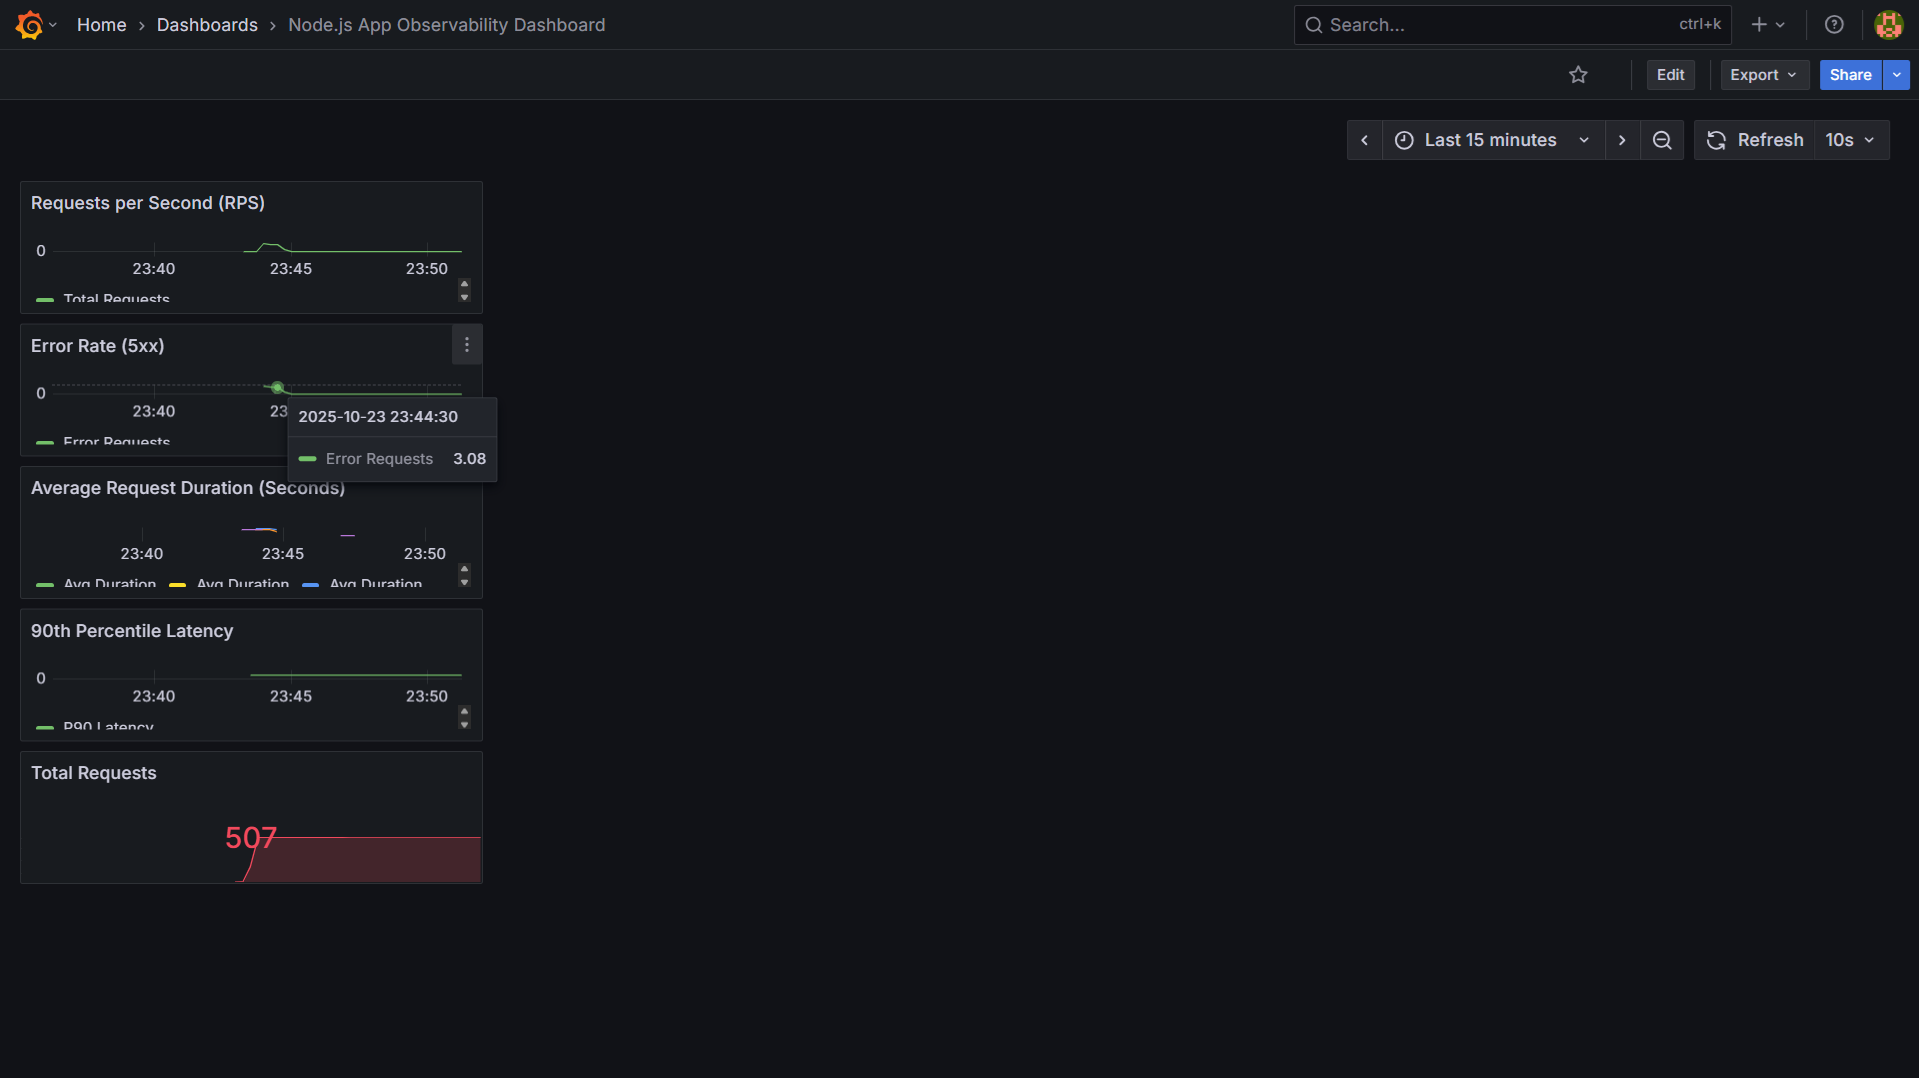
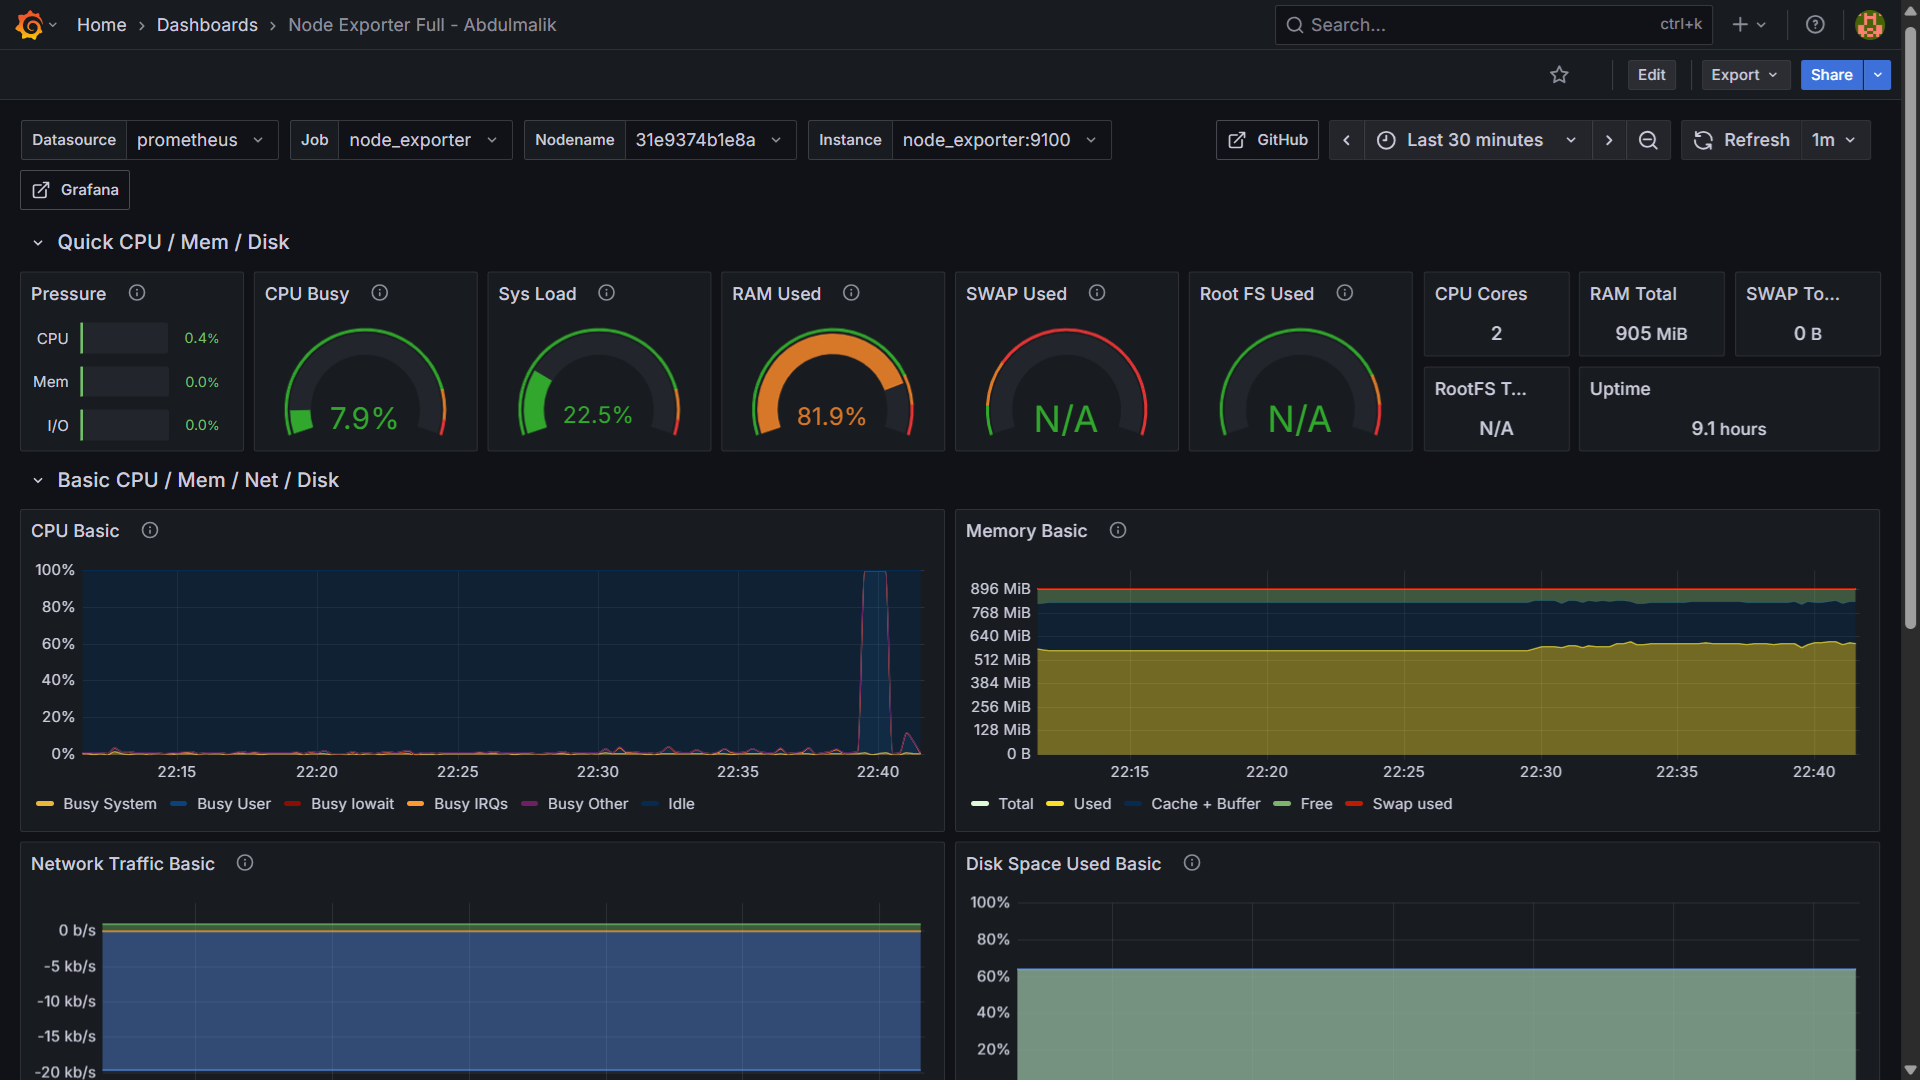
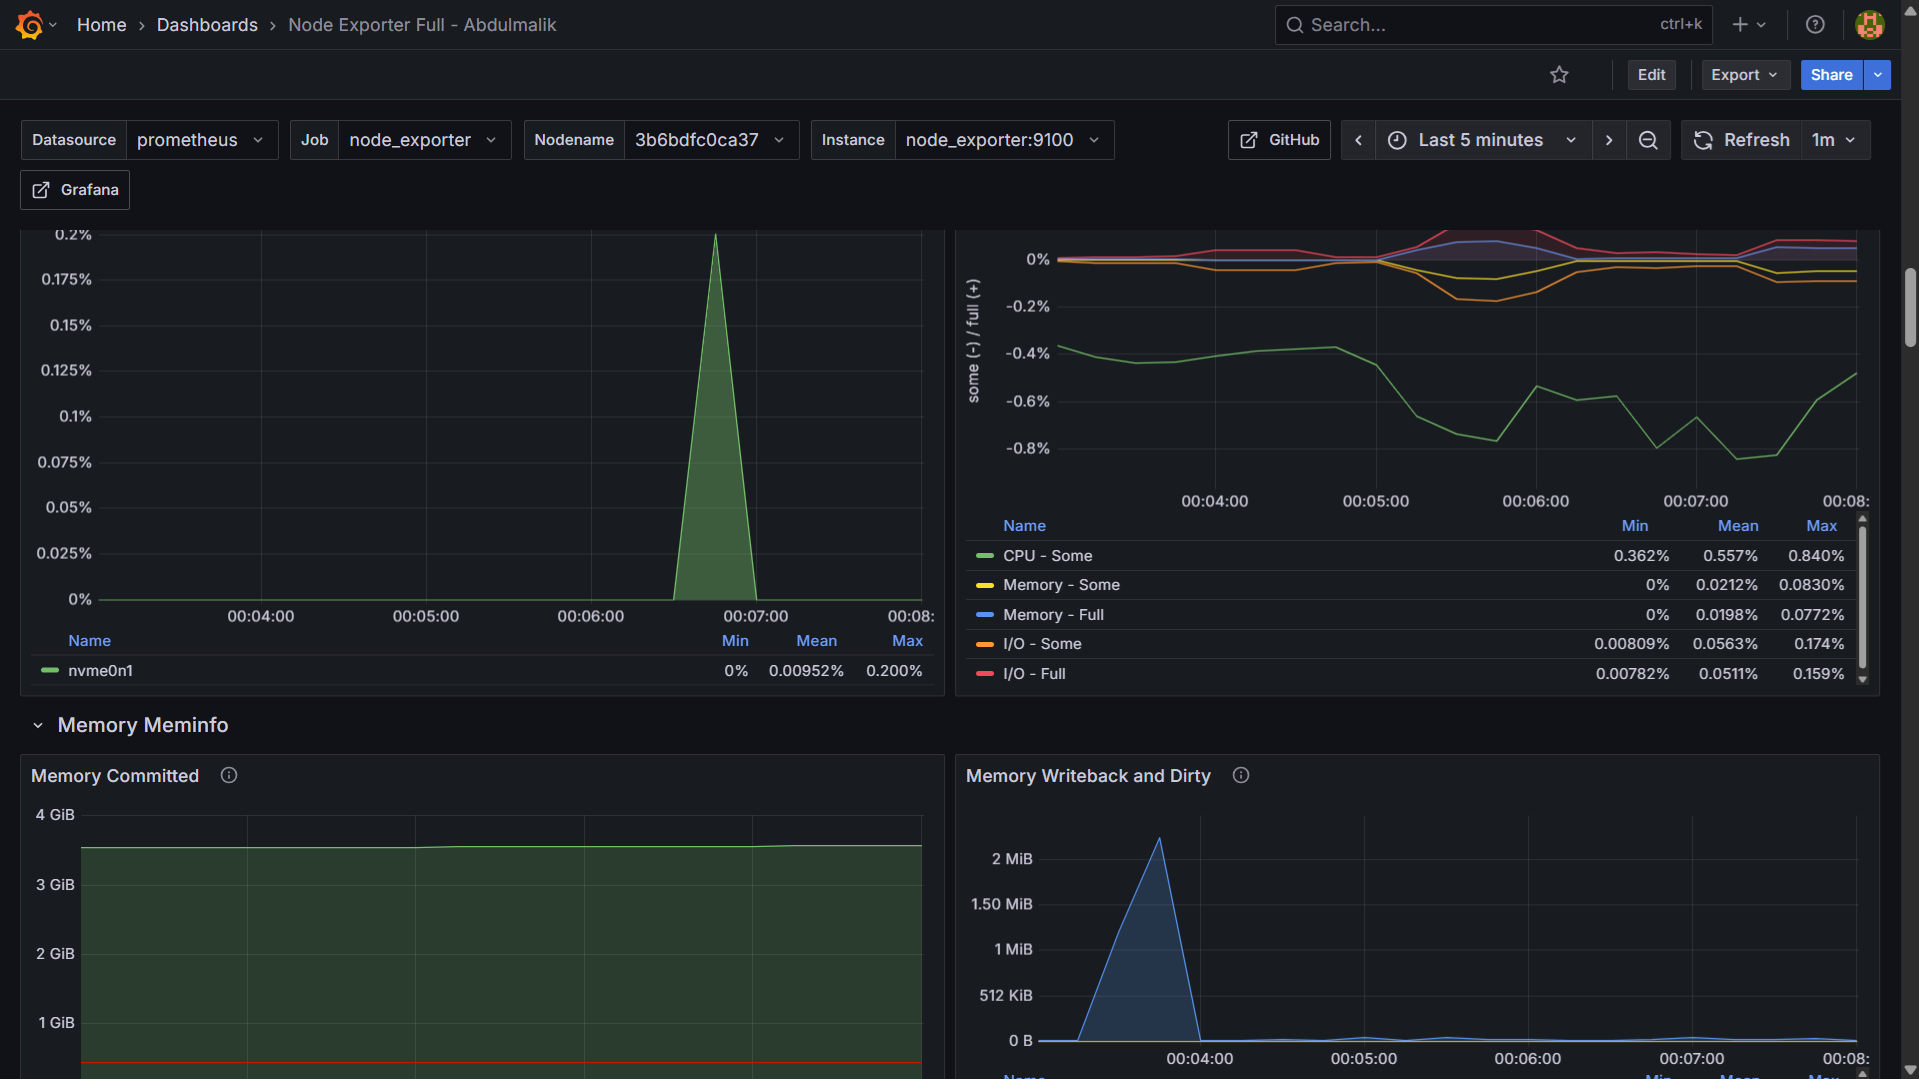
Monitoring Dashboards
Below are live dashboards showing real-time metrics and targets: